Executive Summary
Global logistics activity continues to accelerate as the 90-day tariff pause between the United States and China reaches its midpoint. Significant increases in transpacific ocean freight rates, record cargo volumes at West Coast ports, and capacity utilization exceeding 95% reinforce the current environment of strong demand and operational constraints.
In the United States, diesel prices posted another weekly decline, helping to partially offset cost pressures. However, rail bottlenecks, port congestion, and the growing driver shortage continue to pose significant challenges for shippers and carriers.
The trucking market remains strong, with additional rate increases across Dry Van, Flatbed, and Reefer segments, driven by seasonal summer demand, rising import volumes, and constrained capacity.
1. U.S. National Weather Forecast (June 3–5)
Operational Summary
Favorable Conditions
- Most of the Southeast, Gulf Coast, Ohio Valley, Central Plains, and the I-95 Corridor are expected to experience favorable conditions for trucking operations.
- The ports of Savannah, Charleston, and Port Everglades are expected to operate normally throughout the period.
- No significant disruptions are anticipated for Dry Van or Reefer freight across most of the national logistics network.
Areas of Concern
Northeast (June 3)
- Intermittent rainfall between Boston and Washington, D.C.
- Possible operational slowdowns at the Ports of New York/New Jersey and Philadelphia during the morning hours.
Great Lakes and Midwest
- Isolated thunderstorms and wind gusts up to 40 mph may impact Flatbed operations along the I-90 and I-94 corridors.
Texas and Southern Plains
- Temperatures between 95°F and 100°F require additional attention to refrigerated equipment performance and driver safety.
Pacific Northwest (June 5)
- Moderate rainfall may reduce visibility along I-5 and US-101.
Desert Southwest
- Extreme heat across Arizona and Southern California, with temperatures exceeding 108°F.
- Enhanced monitoring of Reefer equipment and driver fatigue management is recommended.
Logistics Impact
- Port and trucking operations remain broadly favorable nationwide.
- Primary operational risks are concentrated in:
- Rainfall in the Northeast;
- Isolated storms across the Great Lakes region;
- Extreme heat in Texas, Arizona, and California.
- No major weather events are expected to cause widespread disruptions across the supply chain.
2. On-Highway Diesel Fuel Prices
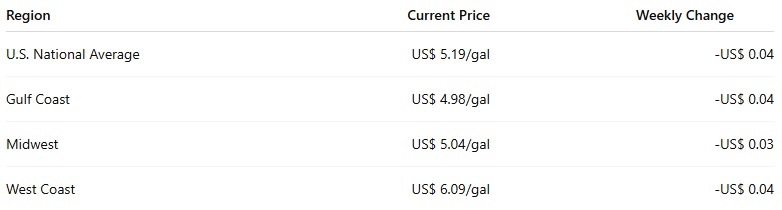
Key Highlights
- Fourth consecutive week of declining diesel prices.
- The West Coast continues to experience the highest operating fuel costs in the country.
- Lower fuel prices are helping to partially ease trucking transportation costs.
3. Rail Congestion Continues to Intensify
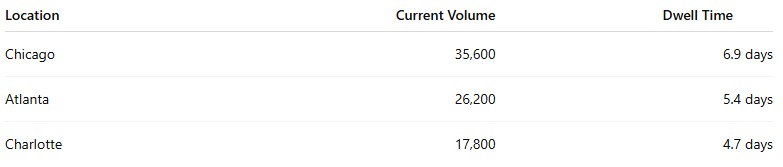
Impact
- Shippers are advised to add at least four additional days to intermodal planning schedules.
4. Red Sea Crisis Continues
- Ocean carriers continue routing vessels via the Cape of Good Hope through at least Q4 2026.
Operational Impact
- Additional transit times of 12–16 days.
- Additional costs of $500–$700 per TEU.
Consequence: European importers continue pulling forward inventory ahead of the summer season.
5. Container Volume & Dwell Times
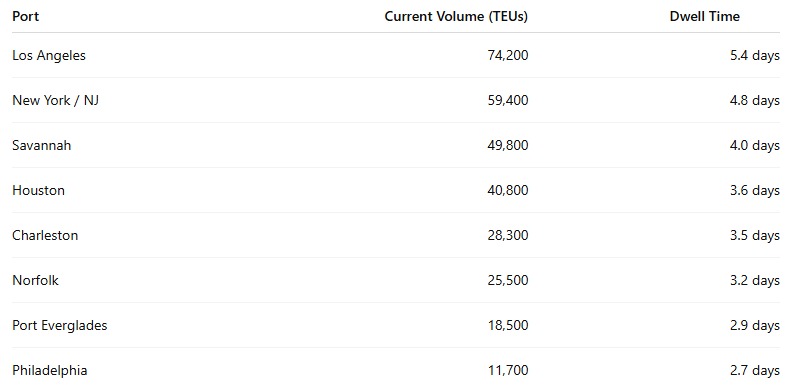
Key Highlights
- Los Angeles remains the leading U.S. container gateway.
- Chicago is experiencing the highest level of rail congestion in the past four years.
- The chart on Page 5 shows continued volume growth across virtually all major U.S. gateways.
6. FTL & LTL Freight Market
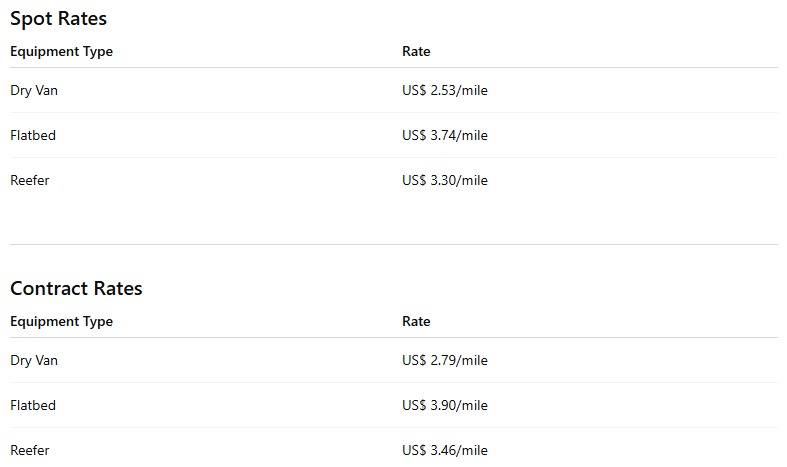
Key Highlights
Dry Van
- Weekly increase of 3¢ per mile.
- Strong demand driven by rising import activity through U.S. ports.
- Capacity utilization has reached 93%.
Flatbed
- 22nd consecutive week of rate increases.
- Rates are 65¢ per mile above the March average.
- Year-over-year growth of 37%.
Reefer
- Fourth consecutive week of gains.
- Rates are up 19.8% year-over-year.
- Strong produce season demand from California, Georgia, and the Pacific Northwest.
LTL Market
- Pricing remains firm.
- Hazardous materials and oversized freight continue commanding premiums between 15% and 25%.
Weekly Market Movement
All major segments posted additional gains:
- Flatbed: +5¢/mile
- Reefer: +6¢/mile
- Dry Van: +3¢/mile
The blended freight index increased by:
+4.7¢/mile
representing the strongest two-week consecutive increase since Q4 2024.
General Conclusion
The North American logistics market remains in a strong expansion phase, driven primarily by accelerated import activity resulting from the U.S.–China tariff truce. Record cargo volumes at West Coast ports, escalating ocean freight rates, and continued increases in trucking rates point to an extremely tight capacity environment across the supply chain.
At the same time, rail congestion, operational constraints at port terminals, and the persistent driver shortage continue to represent significant risks for shippers and logistics providers. Market conditions are expected to remain tight throughout June, particularly across the ocean freight, intermodal, flatbed, and reefer segments.